Unless your business operates on a subscription-based model or you have a high proportion of retained revenue, chances are your sales forecast will be fairly unpredictable.
To help you plan, we recommend you create a separate, pessimistic forecast so that you can prepare for a worst-case scenario.
This Task Should Take No Longer Than 6 Minutes to Complete
- Log-in to your account
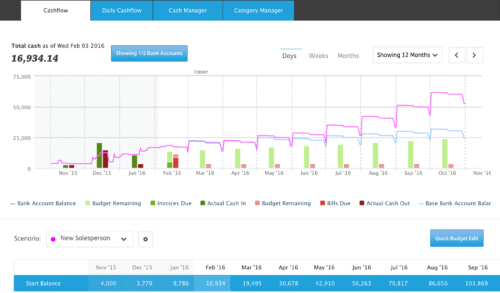
- Click on the “Scenario” dropdown (on the left, just above your cash flow graph)
- Select “Add Scenario Layer”
- In the modal type in your scenario name
- Choose your scenario colour
- Finally, click “Add Scenario Layer” in the bottom right-hand corner
You have now created a copy of your original forecast and can change the numbers without affecting the original.
At first, you will see that your cash flow graph hasn’t changed but will have gone the colour of your chosen scenario.
In order to get the lines of the graph to differentiate, you first need to change some budgets in your cash flow table.
To reflect your scenario, you should select the accounting categories that are most relevant to the changes you want to see. For instance, if you are plotting a scenario of a “New Employee” then you will want to change the payroll line, and potentially your sales line. Other categories will be relevant too, depending on your business.
To let you know which budgets you have changed, your cash flow table will be coloured in the appropriate rows to highlight where your changes have been made.
When you look back to your cash flow graph you will see that the lines have differentiated.
To read more about creating scenarios within Float click here to view our help article.
Alternatively, if you’d like to learn more about what scenario planning can do for your business then read our blog here!
Next Up – Step 8: Project a Late Payment >>