Business Stories

How Do I Calculate Inbound Cash Flow?
Getting a strong handle on how much cash is coming into your business is essential to making informed decisions for your business. Right now, it can be hard to predict what money is going to come into your business and when. The current situation is constantly changing and the uncertainty is inevitably causing many business […]

Why A Cash Flow Forecast Is Important To Your Advisors
If you aren’t already doing a cash flow forecast you probably know that you should be. But maybe you occasionally wonder why a cash flow forecast is important to your accountant, or why your bank manager wants to see one, your why your investor keeps telling you to show them one. A cash flow forecast […]

9 Expert Tips To Instantly Improve Your Business’s Cash Flow
There are many reasons why you may want to improve cash flow in your business. Maybe you’re looking to free up some cash to put towards growth, or maybe you’d like to build up your cash cushion to protect yourself from any bumps in the road. Whatever your reason, we’ve got you covered. Sue Hirst, […]

What Is Burn Rate?
As a new business owner, you know how delicately things must be balanced to ensure that you have enough cash in the company whilst you’re seeking new investment opportunities, growing your customer base and generally getting things off the ground. You may have some venture capital for your start-up and are worried about running out […]

How To Forecast Revenue
As a business owner, it’s important to forecast your revenue so you can guide the company in the right direction, based on solid decision-making. But how can you work out how much money your business will make? What’s the difference between revenue and income? And what’s the best way to work business revenue into your […]

Top Tips For Business Goal Setting In 2024
Are you setting New Year’s resolutions? No, we’re not talking about hitting the gym or eating out less. We mean setting business goals and objectives. Coming into the new year, it’s the perfect time to set some goals – both realistic and aspirational – for your business to work towards. Why set business goals? In […]

Understanding Your Cash Runway
To help your business grow, it’s essential you understand your cash runway. But what is? And why is it so important? Read on to find out…

Why Is Cash Flow Important To A Small Business?
If you’ve got plans for your business, you’re going to need cash to make them happen. Dreaming big and running out of money isn’t a situation a small business wants to find itself in, which is why cash flow is critical to sustaining and growing a business. Time for some hard facts: it’s known that […]
Accounting Tips

Meet The Accountant Who’s Helping The Beauty Industry Manage Cash Flow In A Crisis
If you’d walked into Ria-Jaine Lincoln’s home several years ago, you would have found yourself surrounded by tin cans. Tin cans on every windowsill. Inside the cans were pound coins – these were the kind of tin cans with a hole in the top which you could put money into, but could only take back […]

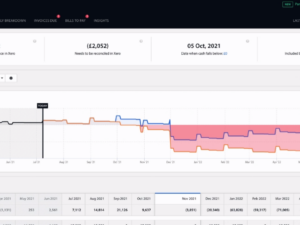
Business Snapshot: Xero’s New Cash Flow Pilot
Back in 2019, on the first day of Xerocon Brisbane, Chief Product & Partner Officer and all-round Xero rockstar, Anna Curzon, announced the arrival of Xero’s new cash flow pilot. Now, Business Snapshot has officially launched and offers Xero users “a dashboard-style report displaying performance measures to help you understand your organisation’s financial position”. This […]

How to Price Float For Your Clients
Deciding how to build app advisory into your services can be a real struggle. Finding a price point and format that works for both you and your clients involves striking a delicate balance. We’ve spoken with our partner accounting and bookkeeping firms, and these are ways our current partners are charging for Float: 1. Include […]

4 Ways To Help Your Clients With A Cash Surplus
The internet is full of advice for small business owners on what to do when facing a cash shortage. But there’s very little content on how to manage a cash surplus. So as an accountant and advisor, how can you help your clients that don’t make the most of the cash available to them? What […]
How To Use Xero in 13 Easy Steps
Xero is an online accounting software designed for small businesses. If you’re new to Xero, then this guide to getting started should help you quickly get up and running. Here are 13 steps to get you started using Xero to get a better handle on your finances. 1.Watch the ‘Xero Dashboard’ video The first step […]
Customer Stories

Growing A Digital Agency With MadeBrave’s Andrew Dobbie
Ever wondered how to start a digital agency? Travelling the world and working with top-class creatives are just two of the reasons Andrew Dobbie loves agency life. From his early days as a freelance designer to founding Glasgow-based creative brand agency MadeBrave, Andrew has shared some brilliant insights with us on how to grow a […]

How A Bespoke Furniture Maker Carved Out 13 More Hours Per Week With Float
Ewan Ogilvie is no stranger to hard work. From his workshop in Fenton Barns – a tiny hamlet in East Lothian, Scotland – Ewan crafts bespoke furniture for businesses and private clients looking for something unique, original and beautifully made. “I was approaching 40 and I had always wanted to set up my own business,” […]
Meet The Accountant Who’s Helping The Beauty Industry Manage Cash Flow In A Crisis
If you’d walked into Ria-Jaine Lincoln’s home several years ago, you would have found yourself surrounded by tin cans. Tin cans on every windowsill. Inside the cans were pound coins – these were the kind of tin cans with a hole in the top which you could put money into, but could only take back […]

How Dog and Pony Studios are using Float
Chris Davies, the owner of Toronto-based creative agency Dog and Pony Studios, started using Float in 2013 and now describes it as an invisible member of the team. How did Float become such an integral part of the business? Dog and Pony Studios were successful: offices opened in Rio de Janeiro and Barcelona, new clients […]
Float News
How To Forecast Cash Flow For A Loan Application
As a small business, you may be struggling to bridge the cash gap between when you’re paying bills and when you’re receiving money. Or maybe you’re wanting your business to grow and you’re looking for investment options. Taking on debt is a very common and relatively cheap way of solving some of these problems. If […]
Float’s 4-week Cash Flow Challenge: Achieve your financial goals in 2024 – Week 1
Set intentions Challenge 1 Exercise: Set aside 15 minutes to reflect on 2023 and set an intention for why you want to start this challenge. Time required: ~ 15 mins Prompts: Questions for reflection:1. How did my business perform financially in 2023, and what were the significant contributing factors to its success or challenges?2. What […]
VAT and Making Tax Digital
How does the Making Tax Digital (MTD) for VAT legislation affect you? Definition of VAT: VAT is an acronym for Value Added Tax. It’s a tax that’s applied to the price of goods, services and other taxable supplies that are bought and sold within the UK. Do I need to be VAT registered? In the UK, […]

How To Prepare For A Funding Round
Most start-ups need to seek funding at some point – and many have to do it more than once. It can be a long and daunting process, but we’re here with everything you need to know when preparing for a round of funding to grow your business. We’ve written this article with businesses at the […]

7 Australian Accountancy Blogs We Love
Australian accounting blogs come in a range of shapes and sizes and cover a huge variety of different topics. From small business advice to detailed updates on legislation changes, there’s something for everyone. Here we round up some of our favourite Aussie accountancy bloggers, who are keeping Australia up to date on all kinds of […]
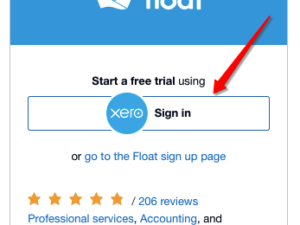
The New Way to Log into Float with Xero’s Single Sign-On
We’re thrilled to be able to offer our new and existing users the ability to sign into Float using Xero’s single sign-on feature! Announced at Xerocon Brisbane 2019 by GM of the Xero Ecosystem, Nick Houldsworth, this new streamlined way to connect your Xero account to Float will save you time whilst keeping still keeping […]
Business Snapshot: Xero’s New Cash Flow Pilot
Back in 2019, on the first day of Xerocon Brisbane, Chief Product & Partner Officer and all-round Xero rockstar, Anna Curzon, announced the arrival of Xero’s new cash flow pilot. Now, Business Snapshot has officially launched and offers Xero users “a dashboard-style report displaying performance measures to help you understand your organisation’s financial position”. This […]

How Xero Pricing Works
To help show you the true value of joining the cloud revolution and integrating with Xero, we’ve got the lowdown on the Xero pricing structure, and how they can help you do beautiful business. In recent years, cloud accounting has gone from strength to strength – becoming increasingly popular the world over. Xero is slowly […]